
Journey From 60k to 15k Vulnerabilities
Using Tromzo Intelligence Graph, of course!

Originally posted on Medium: https://medium.com/@eric_sheridan/journey-from-60k-to-15k-vulnerabilities-d878a684f617
In case you missed it, this cool security startup called Tromzo recently released Intelligence Graph, a patent-pending technology designed to extract additional context from various software assets in an effort to identify ownership and business criticality of those assets. Ever wonder which of those thousands of “Critical” vulnerabilities you should start remediating first? Well, with Intelligence Graph, you can now find an answer backed by your own data!
Obtaining additional context to better prioritize those vulnerabilities most meaningful to the business is not the only benefit and capability afforded by Intelligence Graph. What if the only data you could obtain were the vulnerabilities from the scanning tools themselves? No data from code repositories, artifact registries, cloud platforms, etc. – just good ‘ol vulnerability data. Does this thing called Intelligence Graph offer any value then? I’m happy to reply with a resounding “YES!”; and I can even back it up with a real-world case study!
Recently I was helping a large Financial Services company wrap their heads around a slew of vulnerability data pouring in from two newly introduced security tools: a Static Application Security Testing (SAST) tool and a Software Composition Analysis (SCA) tool. Like most Product Security teams (even in the financial sector), they were severely understaffed. I often find there are upwards of 100 software engineers for every 1 person on the Product Security team. Their primary goal was putting together a remediation game plan to tackle the now heavy vulnerability backlog. I put on my pink button-up shirt (those of you who know me know that’s my ritual before doing something big), got a cup of tea, and immediately went to Intelligence Graph to make sense of all this data. One of the things that I like about Intelligence Graph is the ability to query various aspects of vulnerability data as a means of identifying patterns. If we can identify a common set of vulnerability patterns in the data, then we are very likely to identify a common set of remediation strategies to employ.
The first thing we did was weed out the noise – the stuff we didn’t care about. There were three criteria that stood out within minutes:
- Vulnerabilities associated with test code
- Vulnerabilities found by SAST that were duplicated and better reported by SCA (i.e. CVEs), and
- “Vulnerabilities” that were, well, not actionable to say the least. This resulted in an Intelligence Graph query similar to the following:
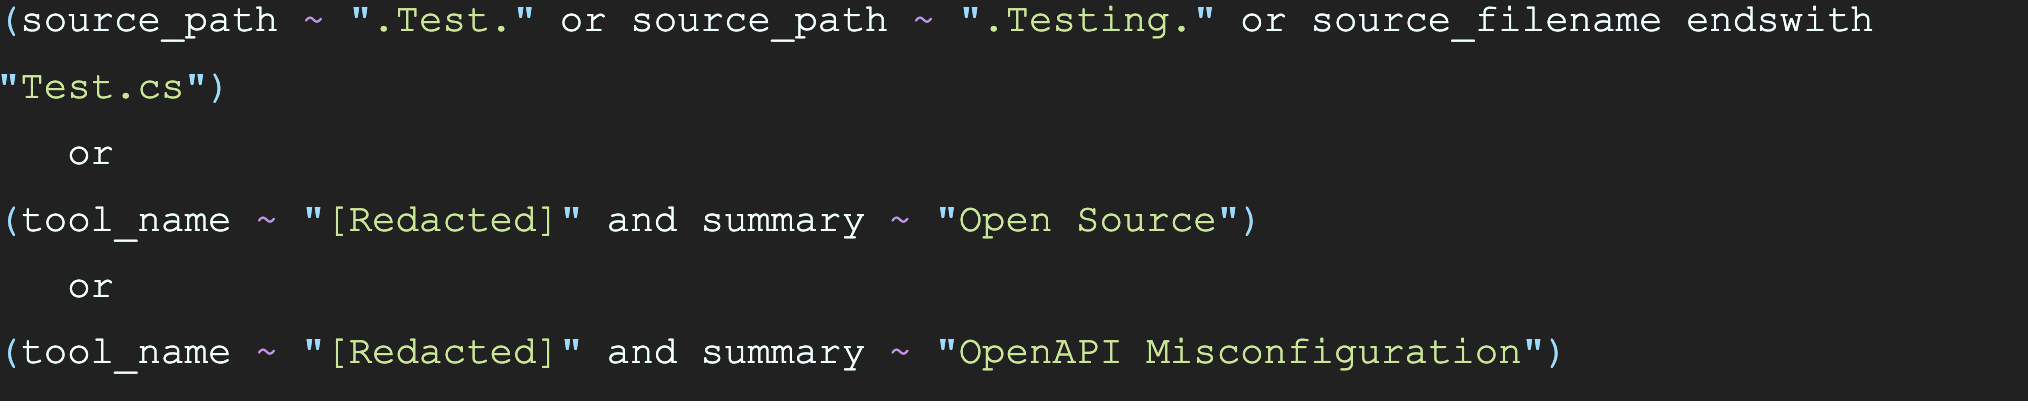
Any vulnerability that matched one of the three criteria expressed in this query were effectively put into a can and kicked for another day. This reduced our findings by about 1,000; representing a 1.5% reduction in less than 15 minutes. Not bad… but we can do better.
The next thing we did was attempt to identify patterns, starting with what information we could gleam from the vulnerability dashboards. We noticed an astounding number of vulnerabilities produced by the SCA tool with a severity of “High”. We were able to extract these specific findings using the following Intelligence Graph query on the vulnerability data:

Instantly we were presented with all of the “High” severity vulnerabilities produced specifically by the SCA tool. As we perused the vulnerability summaries, we noticed the words “Microsoft Corporation” and “License” showing up a number of times. To get a sense of the total number of vulnerabilities incorporating these key words, we modified our Intelligence Graph query as follows:
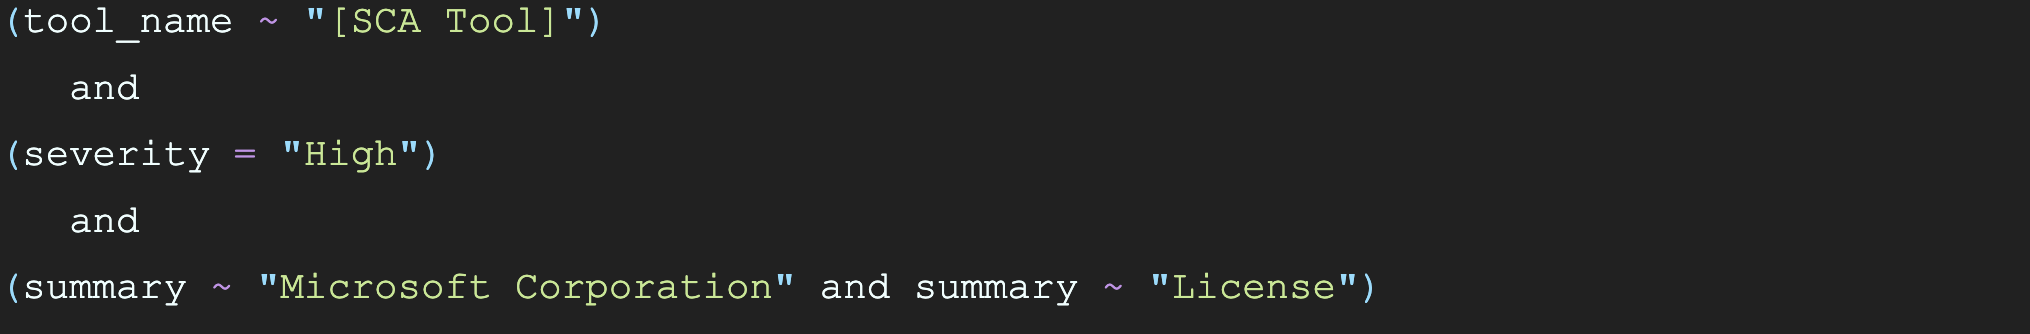
The third condition in this query effectively says “show me vulnerabilities where the words ‘Microsoft Corporation’ and ‘License’ are included in the summary.” When we combined these all together, we hit the jackpot – more than 46,000 vulnerabilities matching this single pattern!
It turns out there were a wealth of applications being developed using older versions of the .NET Framework. Naturally, these applications had dependencies on various .NET libraries produced by Microsoft. According to the SCA tool, these libraries were subject to a Microsoft .NET/Visual Studio license that had not been officially approved by Legal. We grouped all these together in preparation for engaging with Legal to seek approval for use of software depending on these licenses. Given that utilization of this software was consistent with standard practice for .NET applications, the expectation is the license will be approved and these 46k+ of the 60k+ vulnerabilities, or 77%, would simply be closed out. Not bad for 30 minutes of analysis!
If you’re keeping up with the math, that leaves us around 15k remaining vulnerabilities that we need to do something about. Once again, we went back to the dashboards in the Tromzo platform for clues. Cross-Site Scripting (XSS) stood out as a frequently occurring vulnerability, so we decided to look at a few samples. Any meaningful SAST technology these days will have something called “dataflow analysis”, wherein untrusted data is traced from a source (where it was introduced) to a sink (where it goes that is harmful). Looking at the sinks of some of these findings, we began to notice some patterns. One such pattern is the frequent occurrence of the sink “System.Web.UI.WebControls.Label.set_Text”. When you create web pages using older .NET Framework technologies, you’ll make frequent use of Web Controls such as “Label”. There is a property associated with Label called “Text” that can be used to specify the content to display. Unfortunately, this property is vulnerable to XSS as the Label.Text property is displayed as-is without proper contextual output encoding. We attempted to identify other vulnerabilities similar to this using the following Intelligence Graph query:
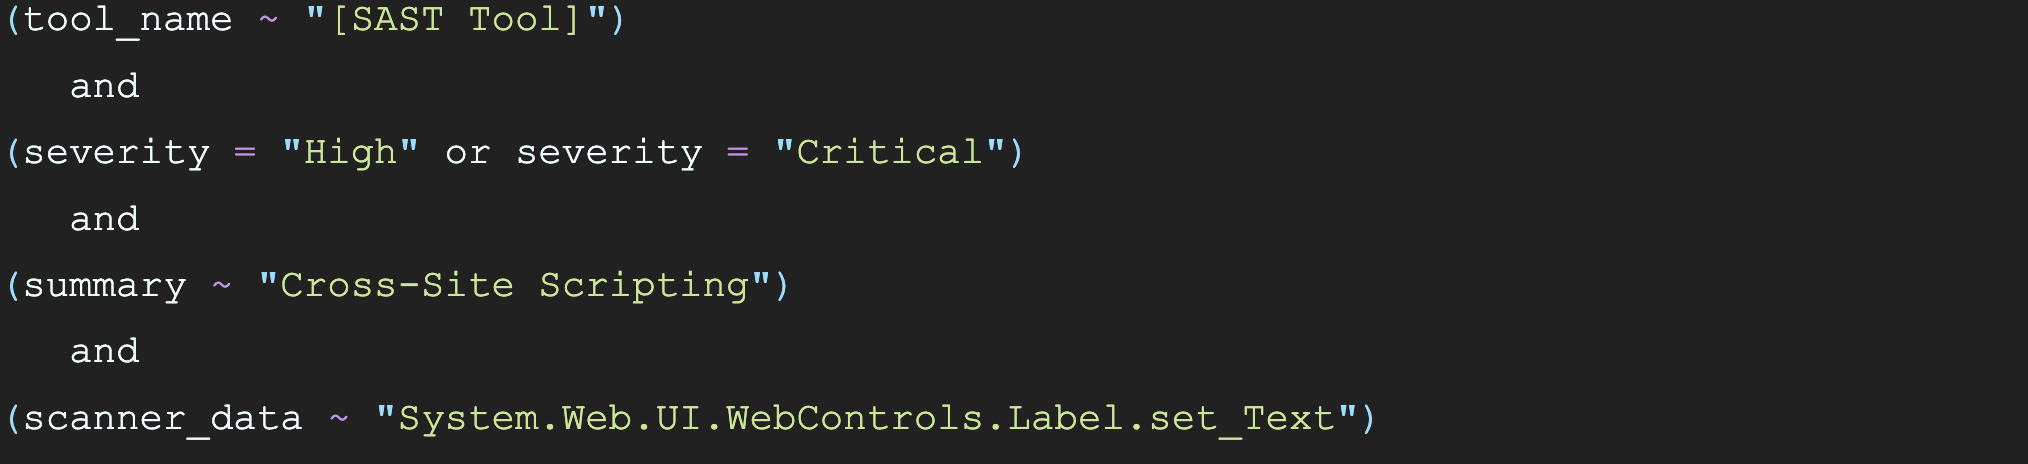
This query says “show me all the ‘High’ or ‘Critical’ XSS vulnerabilities found by SAST associated with the (mis)use of the ‘Text’ property in the ‘Label’ web control.” Immediately we were presented with dozens of findings. What’s interesting about this is that, according to the SAST tool, we need only wrap the right-hand side of the Label.Text property assignment with a call to “HttpServerUtility.HtmlEncode” to mitigate the vulnerability. We decided to batch all these findings together and create a “Remediation Campaign”; educate all developers on this explicit XSS pattern, provide guidance on how to search for the pattern throughout the codebase, as well as guidance on how to replace the pattern with a safer HttpServerUtility.HtmlEncode based pattern. Once executed, the engineering team will be able to effectively remediate potentially hundreds of XSS vulnerabilities within a single Sprint.
We repeated this process of formalizing additional “Remediation Campaigns” based on patterns we observed via our analysis of the vulnerability data using Intelligence Graph. The net result is a clear, concise, and scalable remediation gameplan that can be executed jointly between Engineering and Product Security.
So, there you have it. Intelligence Graph can do tons of cool stuff by pulling in data from various software assets. But, it can also do cool stuff with just the disparate vulnerability data itself.
‘Till next time!
Recent articles
On a recent episode of the Future of Application Security podcast, Chad Girouard, AVP Application Security at LPL Financial, talked about some of the challenges to overcome...
Read moreReady to Scale Your Application Security Program?
Sign up for a personalized one-on-one walkthrough.
